Category: In the News

2018 American Fitness Index Overview Infographic

According to the 2018 ACSM American Fitness Index, the top 10 fittest cities in the U.S. are:

  1. Arlington, VA
  2. Minneapolis, MN
  3. Washington, D.C.
  4. Madison, WI
  5. Portland, OR
  6. Seattle, WA
  7. Denver, CO
  8. St. Paul, MN
  9. San Jose, CA
  10. Boise, ID

Share this infographic and the Fitness Index with your city officials and local leaders to start a conversation on making your city a healthier place for all residents.

Download a PDF of the Infographic here.

We’re Expanding! Fitness Index will now rank America’s 100 largest cities

The American Fitness Index is proud to announce that the 2018 rankings will be released on May 15th! This year’s rankings feature some exciting changes. 

We’re expanding!

For the first ten years of the Fitness Index, the rankings evaluated the 50 largest metro areas. This approach provided important and valuable general messages, but limited the ability to provide targeted assistance to city and community leaders that need specific data at the local level.

With the May 15th release of the 2018 rankings, the Fitness Index will expand to the 100 largest cities in the U.S. This approach distinguishes the largest suburbs from the central cities in the same metro areas. Cities like Plano, TX will now be scored and ranked separately from their Dallas-Fort Worth metro neighbors. The expanded rankings also provide a more inclusive approach by adding cities in states that weren’t represented previously. Welcome to the Fitness Index, Boise, ID!

Despite the shift from metro areas to cities, the methodology and data sources for the Fitness Index remains the same. Learn more about the science behind the Fitness Index here

New tools coming soon

Who doesn’t like fancy new tools? With this year’s rankings release the Fitness Index will also release an interactive city comparison feature. This will allow you to explore differences between cities by comparing to the top ranked city and up to three additional cities. How does NYC compare to LA or Chicago? Does Kansas City, MO rank higher than St. Louis, MO? Which Twin City ranks highest and why? Get curious and let your inner data scientist go to work. 

Reimagined reporting

Using top 10 lists, modern data visualizations, and inspiring stories from cities working to improve, the rankings report provides new insights and summarizes key information across all 100 cities.

All of these changes allow ACSM to provide better, local data to city leaders and targeted assistance to communities that are ready to make healthy changes.

Follow us on Facebook and Twitter and share how you’ll use the 2018 Fitness Index rankings to make your community healthier and more active using #100fitcities.

100 Largest U.S. Cities

Anchorage

AK

Kansas City

MO

Chandler

AZ

St. Louis

MO

Gilbert

AZ

Charlotte

NC

Glendale

AZ

Durham

NC

Mesa

AZ

Greensboro

NC

Phoenix

AZ

Raleigh

NC

Scottsdale

AZ

Winston-Salem

NC

Tucson

AZ

Lincoln

NE

Anaheim

CA

Omaha

NE

Bakersfield

CA

Jersey City

NJ

Chula Vista

CA

Newark

NJ

Fremont

CA

Albuquerque

NM

Fresno

CA

Henderson

NV

Irvine

CA

Las Vegas

NV

Long Beach

CA

North Las Vegas

NV

Los Angeles

CA

Reno

NV

Oakland

CA

Buffalo

NY

Riverside

CA

New York

NY

Sacramento

CA

Cincinnati

OH

San Diego

CA

Cleveland

OH

San Francisco

CA

Columbus

OH

San Jose

CA

Toledo

OH

Santa Ana

CA

Oklahoma City

OK

Stockton

CA

Tulsa

OK

Aurora

CO

Portland

OR

Colorado Springs

CO

Philadelphia

PA

Denver

CO

Pittsburgh

PA

Washington

D.C.

Memphis

TN

Hialeah

FL

Nashville

TN

Jacksonville

FL

Arlington

TX

Miami

FL

Austin

TX

Orlando

FL

Corpus Christi

TX

St. Petersburg

FL

Dallas

TX

Tampa

FL

El Paso

TX

Atlanta

GA

Fort Worth

TX

Honolulu

HI

Garland

TX

Boise

ID

Houston

TX

Chicago

IL

Irving

TX

Fort Wayne

IN

Laredo

TX

Indianapolis

IN

Lubbock

TX

Wichita

KS

Plano

TX

Lexington

KY

San Antonio

TX

Louisville

KY

Arlington

VA

Baton Rouge

LA

Chesapeake

VA

New Orleans

LA

Norfolk

VA

Boston

MA

Richmond

VA

Baltimore

MD

Virginia Beach

VA

Detroit

MI

Seattle

WA

Minneapolis

MN

Madison

WI

St. Paul

MN

Milwaukee

WI

Fruit and Vegetables Fuel Good Health


You were always told you to eat fruit and vegetables – and it turns out that was very smart advice! It has been well established that diet and physical fitness are strongly linked. However, high levels of physical activity can’t make up for a poor diet, any more than healthy eating can remove the need for physical activity. In fact, researchers have consistently reported that exercise alone is not likely to effectively reduce weight – a change in eating patterns is required.

Unhealthy eating is a known risk factor for many leading causes of disease, including heart disease, diabetes, stroke and some cancers. The ACSM American Fitness Index (Fitness Index) includes the percent of residents who report eating the recommended amount of fruit and vegetables as two measures of a healthy diet.


Depending on a person’s age and sex, federal guidelines recommend that adults eat at least one and a half to two cups per day of fruit, and two to three cups per day of vegetables as part of a healthy eating pattern. A good diet provides the needed nutrients for strong bones and muscles that enable us to be physically active. For good health and to support fitness, focusing on improving access to and consumption of fruits and vegetables would be a great strategy for communities across the country.

How many fruits and vegetables are people in your city eating? Find out with the 2017 Fitness Index rankings. Check back in May for the 2018 Fitness Index rankings!

Authors

Terrell W. Zollinger, Dr.P.H, MSPH

Stella L. Volpe, Ph.D., R.D.N., L.D.N., ACSM-CEP, FACSM

Good Sleep: An Indicator of Good Health

Regularly getting a good night’s sleep is so important for good health that it was added as an indicator to the American Fitness Index last year. The 2018 American Fitness Index Rankings will also list “percent getting seven or more hours of sleep per day” as one of the personal health indicators that are used to calculate the final rankings.

The source of data for this indicator is the CDC’s Behavior Risk Factor Surveillance System (BRFSS) national telephone survey. As you might imagine, the telephone survey methods used are very rigorous to make sure the results are as accurate as possible. Consequently, many medical and public health researchers rely heavily on the BRFSS for their work. Learn more about the BRFSS national survey on the CDC website.

A question on the national survey asks, “On average, how many hours of sleep do you get in a 24-hour period?” As an answer, responders give a number – like six and a half or eight. Generally, experts believe at least seven hours of sleep per day are needed to stay healthy, so this is the measure used for the indicator.

In calculating the Fitness Index scores, each indicator is given a weight from one to three to match how important each indicator is for fitness. Our national experts agreed that getting a good night’s rest was so important that it should be given the highest level of weight (three).

Why is sleep so important to health? 

Sleep influences processes in the brain that allow it to remember and learn new information. It can also influence brain linkages that increase the ability to concentrate and feel positive emotions. People who get more rest have more energy for tackling difficult tasks. Getting enough sleep also helps to control weight by increasing the body’s ability to burn carbohydrates.

On the other hand, having too little or poor quality sleep turns on hormones that affect appetite and promote carbohydrate storage that leads to weight gain. Sleep can also affect heart health: not getting enough sleep can increase the risk for heart disease by increasing high blood pressure, stress hormones and irregular heartbeats.

What is the solution?

Getting at least seven hours of sleep a day is possible by practicing what sleep experts call good sleep hygiene. These are different practices and habits that promote sleep quality and daytime alertness. Here are a few hints:

  • Limit daytime naps to 30 minutes so you are tired at night.
  • Avoid stimulants such as caffeine and nicotine close to bedtime.
  • Exercise to increase your physical energy and allow your tired muscles to relax for a good night’s rest.
  • Avoid watching TV in the bedroom, as the artificial light can disrupt sleep rhythms.
  • Avoid eating foods that may disrupt your digestive system right before bedtime.

Check out the Fitness Rankings to see how well people in your city are sleeping!


Authors

Barbara E. Ainsworth, Ph.D., M.P.H., FACSM, FNAK

Terrell W. Zollinger, Dr.P.H, MSPH

Physically active families: Creating healthy habits this fall

In many ways, Fall is a “new year” for American families. For those whose annual schedule revolves around the academic calendar, fall is a time for new beginnings and fresh starts. In the spirit of back-to-school season, ACSM’s American Fitness Index hosted a Twitter chat with some of our subject matter expert members who offered advice to families looking to kick-off the school year with healthier habits.

Plan to eat for success

First, Tanya Halliday, Ph.D., R.D. chimed in on tips for eating seasonally, packing healthy lunches and feeding families under the most serious of time-crunches.

“Apples and pumpkin get a lot of action in the fall. Rightfully so—they are delicious, nutritious and versatile produce. But don’t overlook other fall produce like zucchini, eggplant, cantaloupe, pears and others that are in season in many parts of the U.S.”

Halliday also offered a Seasonal Produce Guide  for knowing which fruits and vegetables are in season throughout the year. It’s important to know what produce is the freshest when visiting your local farmers’ market or grocery store!

As far as packing healthy, well-rounded lunches for school and work? Planning ahead is key!

“Plan lunches for the week with your children,” Halliday suggests. “If they are involved in prepping and packing they are more likely to eat it!” Planning ahead also allows you to accurately pack a balanced meal, as opposed to throwing things in a bag during a rushed morning only to find out later that you’ve completely missed key nutrients.

Think about pre-portioning foods, like an individual bag of carrot sticks with a small container of hummus, to make mornings very grab-and-go. It’s also worth-while to invest in insulated lunch bags and ice packs that will keep food at a safe temperature and reduce the risk of food poisoning.

With full family schedules, mornings can be rushed and dinners are often on-the-go or scheduled at home with little time to prepare.

“Planning, prepping, bulk cooking and convenience items can help during the rushed days,” Halliday shared. “I am all about bulk cooking and taking advantage of the freezer for storage.”

Additionally, there are many make-ahead breakfast options like overnight oats and, when dinner is rushed, fast options like frozen vegetables in a steam bag can get meal prep done in a flash!

Encouraging active play

We all know that it’s easy to come home from work or school and lay down on the couch for some TV or internet surfing. Avery Faigenbaum, Ed.D., FACSM, shared his thoughts on how to keep moving and make fitness a family affair.

“Walk the dog, ride bikes, play ball or even bring out the hula hoops!” he said, emphasizing the importance of the whole family having fun while being active together. “Each week try to plan at least one activity together [as a family]—outdoor play, a pick-up game or a hike at a local park.”

But what about when the weather turns too cold or rainy to be outside? “Move the furniture aside and have dance parties,” Faigenbaum suggested. “Let each family member pick a song and get dancing.” Balloon volleyball and indoor hopscotch are other easy ways to get moving, even if you’re in a confined indoor space.

Our favorite suggestion? “Create an indoor zoo full of animal movements!” Faigenbaum added. “Think crocodile planks, bunny hops, frog squats and mountain goat climbers.” To learn more about Faigenbaum’s approach to keeping kids active and healthy, check out his recent article is ACSM’s Health & Fitness Journal.

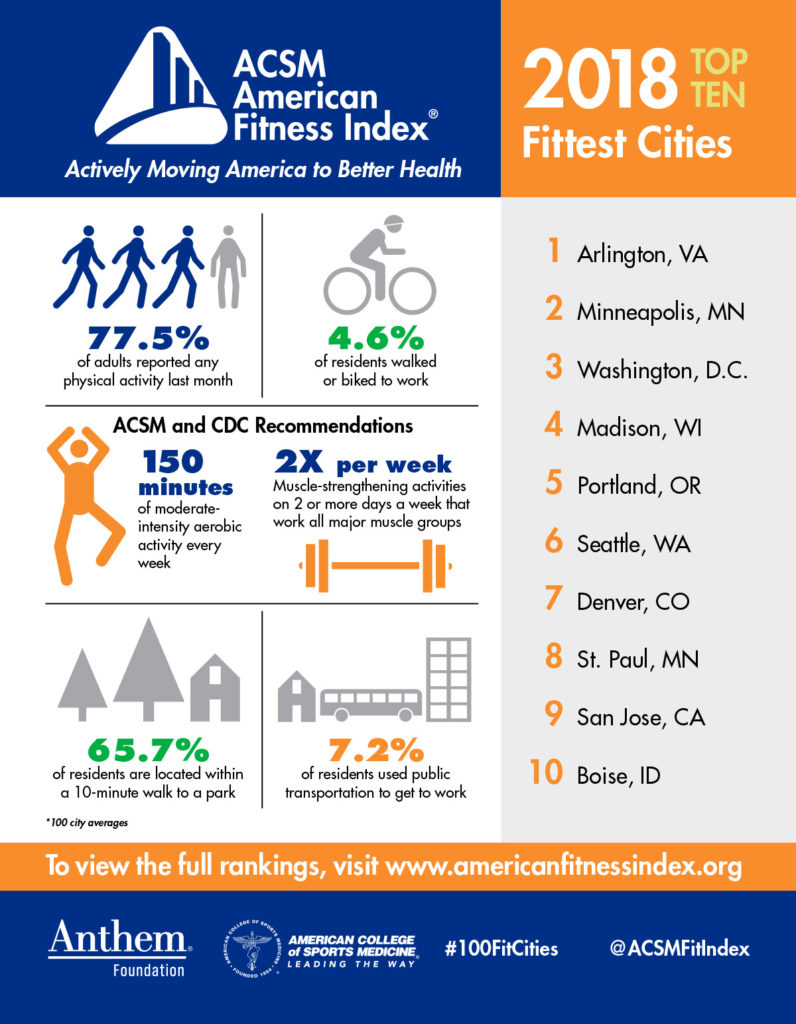
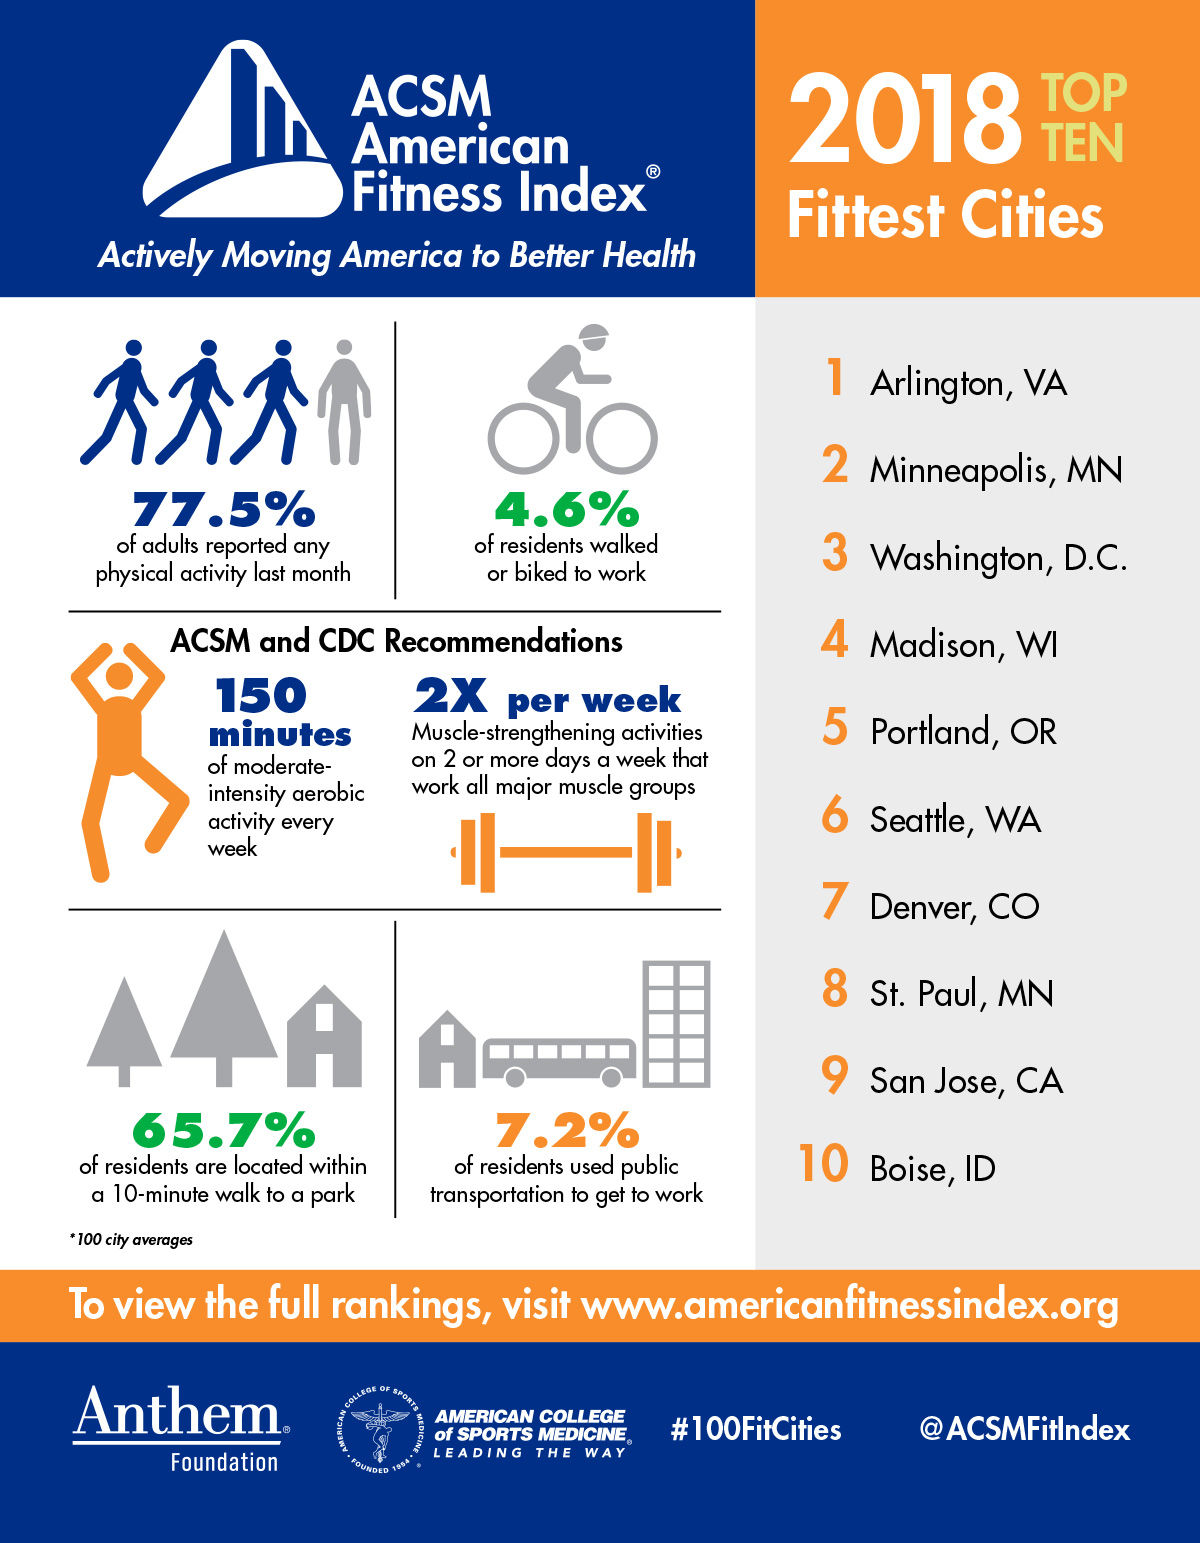
These are all great ideas, but how do you know if your family is getting enough physical activity to be healthy? “Kids need to accumulate at least 60 minutes of physical activity every day,” Faigenbaum says. “And it does not need to be 60 consecutive minutes.” For adults, the American College of Sports Medicine recommends at least 150 minutes of moderate intensity exercise per week, done in at least 10-minute intervals. It is also recommended to complete resistance training of each major muscle group 2-3 times per week.

The key takeaway for healthy active families is fun. As long as everyone is enjoying the activity, they will keep moving!

Seeking out community resources

Many communities across America have facilities and other resources to help your family stay active year-round. Dr. Walt Thompson, Ph.D., FACSM and 61st President of the American College of Sports Medicine, reminded families that city parks and recreation centers are great options if your outdoor space is limited or the weather restricts your activities. Your local Parks & Recreation Department should have a full list of available facilities on their website.

Do you think that your local community could improve its offering of resources for health and wellness? Download the American Fitness Index®’s Community Action Guide to learn how you can make a difference in the health of your own community!

10th Annual American Fitness Index Reveals Minneapolis-St. Paul as the Newest “Fit City”

Half of metro areas saw scores improve

Indianapolis (May 16) – The twin cities of Minneapolis-St. Paul edged Washington, D.C. in the 10th annual American Fitness Index (Fitness Index) rankings released by the American College of Sports Medicine (ACSM) and the Anthem Foundation, the philanthropic arm of Anthem, Inc.  The nation’s capital held the top spot for the past three years and improved its score in 2017, but Minneapolis-St. Paul still finished on top despite the challenges of being a northern state with hard winters. (Link – View the rankings and individual metro data here or at the chart below.)

San Francisco-Oakland finished third this year, Seattle-Tacoma fourth, San Jose fifth, Boston sixth and Denver seventh. The top seven cities in the 2017 Fitness Index are between 4-13 percentage points ahead of the rest of the pack, principally related to lower rates of smoking and cardiovascular disease deaths and higher reported physical activity, consumption of fruits and vegetables, and per capita park expenditures in their communities.

Nationally, there were some remarkable positive shifts during the last year:

  • 16.0% increase in the percent who met the recommendations for aerobic and strength in the last 30 days
  • 10.5% drop in the percent with diagnosed angina or coronary heart disease
  • 3.9% increase in walkability scores
  • 3.9% increase in the percent who live within a 10-minute walk to a park
  • 3.7% increase in the total park expenditures per capita
  • 4.0% increase in the number of recreation centers per 20,000 residents

Metropolitan Statistical Areas (MSA) with the greatest improvement in their rankings since last year included San Jose, Los Angeles, Miami, Buffalo, Orlando and Las Vegas.

The 2017 Fitness Index rankings also revealed some shortcomings over the past year:

  • 11.7% increase in the rate of diabetes deaths
  • 6.3% reduction in the percent of residents biking or walking to work
  • 6.2% decrease in the percent of individuals eating the recommended number of servings of fruit
  • 4.6% reduction in the number of tennis courts per 10,000 residents

MSAs experiencing the largest drop in their rankings this year included Virginia Beach, Richmond, Providence, Philadelphia, Kansas City, New Orleans and Charlotte.

Against the backdrop of its 10th anniversary,  the Fitness Index offers some insightful long-term trends:

    • Smoking rates have declined (18.7% to 16.7%)
    • Drops in the death rates for diabetes (24.0/100,000 to 18.7/100,000) and cardiovascular diseases (223.0/100,000 to 174.6/100,000)
    • The number of farmers’ markets have increased (11.0/1,000,000 to 19.8/1,000,000)
    • Increases in the percent of residents using public transportation to work doubled (2.1% to 4.4%)
    • Residents biking or walking to work doubled (1.3% to 2.9%)
    • Total park expenditures per capita increased ($100 to $106)

Conversely, the 10-year comparison of Fitness Index indicators uncovered some challenges:

    • The percent categorized as obese increased (25.4% to 28.7%)
    • The percent self-reporting as having excellent or very good health declined (55.6% to 52.1%)
    • The percent diagnosed with asthma increased (8.2% to 9.0%), as did the percent with diabetes (8.0% to 10.7%)

The ACSM American Fitness Index provides evidence-based data and a number of valuable resources that help cities promote healthy lifestyles.  To aid communities in promoting physical activity and enhancing quality of life, ACSM and Anthem Foundation developed and released  the Community Action Guide offering an overview of the critical decisions and factors related to effective community action:  https://americanfitnessindex.org/community-action-guide/

“Our ultimate goal is to offer individuals, families and communities trusted resources that can help them assess, plan and implement policies that promote positive health outcomes,” said Walter R. Thompson, Ph.D., FASCM, who chairs the Fitness Index Advisory Board and is president-elect of ACSM. “Ten years of evidence-based data offers these cities and their citizens valuable insights into how to substantively improve elements leading to healthier lives and reduced health care costs.”

“As the American Fit Index celebrates its 10th year, it’s a great opportunity to celebrate the efforts of communities and their leaders who have effectively used the data to make measurable changes that are helping improve the health and wellness of their residents,” said Craig Samitt, MD, chief clinical officer, Anthem, Inc. “While the improvements we are seeing are worth celebrating, we know there is still more that can be done. We are proud of our foundation’s work and collaboration with ACSM to offer science and evidence for communities to create a culture of healthy lifestyles.”

At the community level, the Fitness Index has been used as an assessment and evaluation tool to educate community leaders on the importance of key indicators of physical activity. Leaders can then focus on policy, systems and environmental change strategies that are evidence-based and create sustainability for the community.

The 2017 ACSM American Fitness Index rankings are as follows:

2017 Rank 2016 Rank Metropolitan Area 2017 Score
1 2 Minneapolis-St. Paul-Bloomington, MN-WI 80.2
2 1 Washington-Arlington-Alexandria, DC-VA-MD-WV 79.2
3 5 San Francisco-Oakland-Hayward, CA 73.3
4 6 Seattle-Tacoma-Bellevue, WA 72.2
5 11 San Jose-Sunnyvale-Santa Clara, CA 71.6
6 7 Boston-Cambridge-Newton, MA-NH 71.5*
7 3 Denver-Aurora-Lakewood, CO 71.5*
8 4 Portland-Vancouver-Hillsboro, OR-WA 67.7
9 8 Salt Lake City, UT 66.3
10 10 San Diego-Carlsbad, CA 65.6
11 13 Sacramento–Roseville–Arden-Arcade, CA 63.3
12 15.5± Austin-Round Rock, TX 61.2
13 9 Hartford-West Hartford-East Hartford, CT 60.5
14 15.5± Raleigh, NC 58.6
15 12 Chicago-Naperville-Elgin, IL-IN-WI 58.4
16 29 Los Angeles-Long Beach-Anaheim, CA 55.7
17 14 Atlanta-Sandy Springs-Roswell, GA 55.0
18 22 New York-Newark-Jersey City, NY-NJ-PA 54.5
19 26 Tampa-St. Petersburg-Clearwater, FL 54.1
20 17 Baltimore-Columbia-Towson, MD 54.0
21 20 Milwaukee-Waukesha-West Allis, WI 53.9*
22 23 Cincinnati, OH-KY-IN 53.9*
23 32 Miami-Fort Lauderdale-West Palm Beach, FL 52.6
24 35 Buffalo-Cheektowaga-Niagara Falls, NY 52.5
25 43 Orlando-Kissimmee-Sanford, FL 52.3
26 28 Saint Louis, MO-IL 51.6
27 19 Virginia Beach-Norfolk-Newport News, VA-NC 50.7
28 25 Cleveland-Elyria, OH 50.0
29 27 Pittsburgh, PA 49.0
30 18 Richmond, VA 48.9
31 21 Providence-Warwick, RI-MA 48.4*
32 24 Philadelphia-Camden-Wilmington, PA-NJ-DE-MD 48.4*
33 34 Phoenix-Mesa-Scottsdale, AZ 47.3*
34 41 Las Vegas-Henderson-Paradise, NV 47.3*
35 31 Jacksonville, FL 46.0
36 30 Kansas City, MO-KS 45.0
37 36 Riverside-San Bernardino-Ontario, CA 44.5
38 37 Dallas-Fort Worth-Arlington, TX 43.2
39 33 New Orleans-Metairie, LA 41.7
40 40 Houston-The Woodlands-Sugar Land, TX 39.0
41 38 Columbus, OH 37.4
42 46 Nashville-Davidson–Murfreesboro–Franklin, TN 36.8
43 42 Detroit-Warren-Dearborn, MI 35.8
44 45 San Antonio-New Braunfels, TX 34.7
45 47 Memphis, TN-MS-AR 33.2
46 44 Birmingham-Hoover, AL 31.2
47 39 Charlotte-Concord-Gastonia, NC-SC 30.3
48 50 Indianapolis-Carmel-Anderson, IN 29.9
49 49 Oklahoma City, OK 29.4
50 48 Louisville/Jefferson County, KY-IN 23.1

±There was a tie in the ranking between the MSAs.

*The scores shown have been rounded to the nearest tenth of a point resulting in some apparent ties; however, the rankings are based on the full calculated score values that were not equal in those cases.

Methodology

ACSM, the Indiana University School of Family Medicine and a panel of 26 health and physical activity experts developed the methodology to analyze U.S. Census data; data from the U.S. Centers for Disease Control and Prevention’s Behavioral Risk Factor Surveillance System (BRFSS); The Trust for the Public Land City Park Facts; and other existing research data in order to give a scientific, accurate snapshot of the health and fitness status at a metropolitan level.

ACSM is a global leader in promoting the benefits of physical activity and advocates for legislation that helps government and the health community make it a priority. ACSM encourages Congress to support continued funding of parks, trails and safe routes to school, as well as the need for all Americans to meet the prescribed physical activity recommendations included in the National Physical Activity Guidelines, and the need for the guidelines to be regularly updated every 10 years.

The data is made up of personal health, community and environmental indicators. Visit the online newsroom at www.AmericanFitnessIndex.org for a complete list of the data components.

About the American College of Sports Medicine

The American College of Sports Medicine is the largest sports medicine and exercise science organization in the world. More than 50,000 international, national and regional members are dedicated to advancing and integrating scientific research to provide educational and practical applications of exercise science and sports medicine.   More details can be found at http://www.acsm.org/

About Anthem Foundation

The Anthem Foundation is the philanthropic arm of Anthem, Inc. and through charitable contributions and programs, the Foundation promotes the inherent commitment of Anthem, Inc. to enhance the health and well-being of individuals and families in communities that Anthem, Inc. and its affiliated health plans serve. The Foundation focuses its funding on strategic initiatives that address and provide innovative solutions to health care challenges, as well as promoting the Healthy Generations Program, a multi-generational initiative that targets specific disease states and medical conditions. These disease states and medical conditions include: prenatal care in the first trimester, low birth weight babies, cardiac morbidity rates, long term activities that decrease obesity and increase physical activity, diabetes prevalence in adult populations, adult pneumococcal and influenza vaccinations and smoking cessation. The Foundation also coordinates the company’s year-round Associate Giving program which provides a 50 percent match of associates’ pledges, as well as its Volunteer Time Off and Dollars for Doers community service programs. To learn more about the Anthem Foundation, please visit http://www.anthem.foundation and its blog at http://anthemfoundation.tumblr.com.

ACSM American Fitness Index Through the Years

In 2017 the ACSM American Fitness Index celebrates it’s 10th anniversary. For the last decade, the Fitness Index has been recognized as an assessment and evaluation tool to educate community leaders on the importance of key indicators of physical activity. With the support of supplementary resources such as the Community Action Guide and My Community Application Toolkit, leaders can focus on policy, systems and environmental change strategies that are evidence-based and create sustainability for the community.

Nationally, there have been noticeable long-term trends in the rankings that are both positive and negative. The positive trends include: smoking rates have declined two percent since the first rankings, more residents are biking and walking to work, and the number of farmers’ markets have increased. A few negative long-term trends have also become noticeable: the percent categorized as obese increased, the percent self-reporting as having excellent or very good health declined, and the percent of people diagnosed with asthma increased.

The Fitness Index celebrates the efforts made to improve the health and wellness of residents and urges all communities to identify opportunities for improvement.  For more information on highlights over the last 10 years, download the infographic below or details specific to your city can be found at www.americanfitnessindex.org/report/.

Surgeon General’s Call to Action

CTA Web Banner

Only half of American adults get enough physical activity to reduce the risk of chronic disease, the leading cause of death in the U.S.  Walking is an easy way to start & maintain a physically active lifestyle. Step it Up! The Surgeon General’s Call to Action to Promote Walking and Walkable Communities provides recommendations to increase walking & walkable communities…everywhere. Learn what you can do to help build a more walkable nation!

Taking Shape of the American Fitness Index

The editors of SHAPE magazine pulled out a few statistics from the 2014 ACSM American Fitness Index® data report for its readers. The Fitness Index provides a snapshot of the state of health in America’s 50 largest metro areas and evaluates the infrastructure, community assets and policies that encourage healthy and fit lifestyles.

SHAPE notes that you can get in shape anywhere, “but it’s easier when you hometown fosters healthy behavior.” Following are a few notable stats highlighted in the article. Click here to read the full article and to learn more about the interesting stats underscored by SHAPE.

•26% of New Orleans is made up of parkland, making it the greenest city in America
•84% of San Jose citizens have a BMI of less than 30
•San Diego residents consume the most recommended servings of fruit
•San Jose residents are tops at the getting the recommended intake of vegetables
•61% of Minneapolis area residents consider themselves in good health
•Few Americans get the recommended minutes of aerobic activity, only 28% percent in Washington, D.C., the top city in this year’s report
•There are 326,603 smokers in Louisville, Ky

View the complete 2014 report or to see how your city ranked this year.

Today Show Looks to ACSM for America’s Healthiest City

To help kick off 2014, The Today Show looked at where in America you should go if you want to be “healthy, wealthy and wise”.

In their search for evaluating America’s healthiest cities, the show’s producers examined a number sources and ultimately settled on the ACSM American Fitness Index®. For the past three years Minneapolis/St. Paul has earned the highest ranking.

ACSM and the Fitness Index Advisory Board are honored to be considered as the best measure of a “healthiest” city. It’s a testament to the research and planning that went into creating the Fitness Index and the work to update the rankings each year since 2008.

For the segment on The Today Show, journalist Craig Melvin spoke with runners and bikers using the city’s expansive trails and paths, highlighted Minneapolis’ robust park and recreation system, and featured a healthy food program called Urban Roots.

The segment also included a portion of an interview with Fitness Index Advisory Board Chair Dr. Walt Thompson.

Check out the segment and read the story on The Today Show website. The 2014 report will be released in May ahead of the ACSM Annual Meeting.

Visit NBCNews.com for breaking news, world news, and news about the economy