Since the creation of the ACSM American Fitness Index®, the data team constantly looks for ways to improve the rankings. Also, as data sources change the information they gather, we must make changes in the indicators that are used. Both improvements and data source changes took effect as we prepared the 2019 Fitness Index rankings.
The data team worked closely with the experts on the Fitness Index Advisory Board to add four new measures to make the Fitness Index more complete:
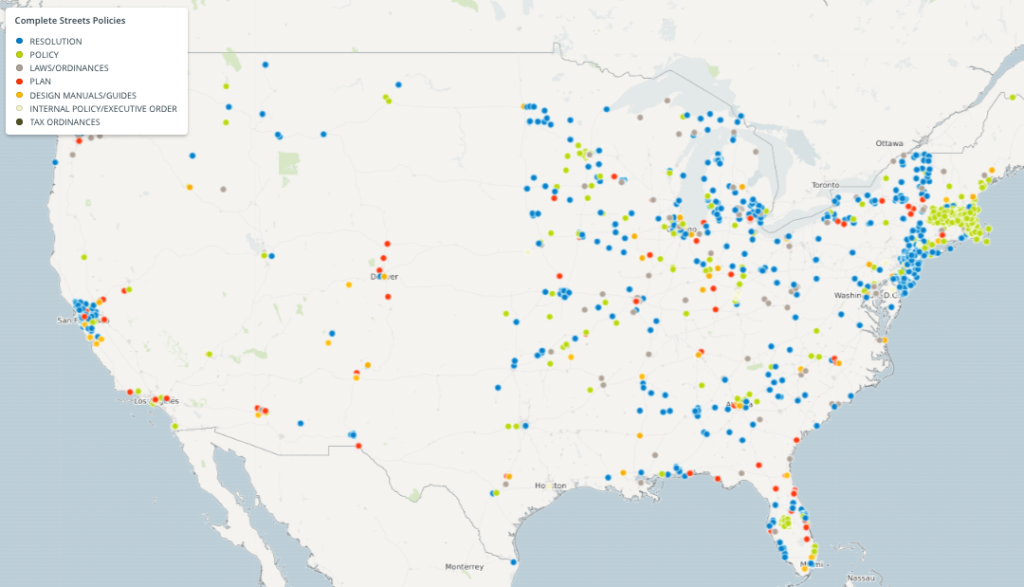
- Complete Streets policy
- Pedestrian fatality rate
- Bike Score®
- Air quality index
These new indicators reflect the importance of policy and built environment in supporting active living that will lead to improved personal health outcomes. For example, cities that successfully implement Complete Streets policies can reduce pedestrian fatalities. Likewise, cities with high Bike Scores help to ensure bicyclists are safe and comfortable riding for transportation and recreation, which improves physical and mental health. While air quality is not often thought of in relation to physical activity, poor air quality has been shown to discourage physically active lifestyles, especially among people with respiratory limitations like asthma or COPD.
The data team also removed three indicators to help balance the Fitness Index and removed one indicator that no longer had a reliable data source:
- Parkland as percentage of city
- Acres of parkland/1,000 residents
- Dog parks/100,000 residents
- Percentage of residents getting 7+ hours of sleep/day
The three park-related indicators were removed to focus on the built environment characteristics that have a measurable effect on physical activity behaviors and health outcomes. The Behavior Risk Factor Surveillance System stopped regularly asking how much sleep people got on average; as a result, the sleep measure was removed from the list of indicators.
The data team also made some adjustments in the placement and weight applied to a few indicators to improve balance and consistency. Even with these changes, the 2019 Fitness Index includes the same number of indicators as were used in 2018 (33), and most of the indicators did not change.
The data team and Fitness Index Advisory Board do not make decisions about changes in the Fitness Index lightly, because cities need to know if their level of “fitness” is getting better from year to year. A lot of discussion and debate occurs among our expert advisors whenever changes are considered. The experts must be convinced that the changes follow current scientific thinking and will make the Fitness Index better; however, we also realize substantial changes cause problems when comparing rankings and scores over time.
With these changes, you might be wondering, “How do these changes impact my city’s score and ranking for 2019?” We believe that the 2019 Fitness Index is a more accurate and fair measure of your city’s fitness, which is a really good thing. However, when you compare the rankings and scores in 2019 to those reported in 2018, part of the shift may be due to the changes in the methods. For example, cities that have invested in making their streets and neighborhoods safer for walking and biking may see a better ranking in 2019 compared to last year, while cities that have larger and more parks may see a drop in the rankings due to these changes.
Advice for interpreting your city’s rank and scores for 2019
Although it is a natural inclination, please don’t compare the overall ranking and scores to those of previous years. Part of the change in rankings could be due to the updates that were made this year. Instead, look at where your city falls generally in relation to the other cities on the list. Is your city in the top 25, in the bottom 25 or somewhere in the middle?
What you also can and should do, is compare your city’s individual indicators from 2018 to 2019 to see which ones improved. After all, the goal of the Fitness Index is to see if your city’s residents are getting healthier and if there have been improvements in your city’s infrastructure to encourage healthy behaviors.
As always, our team here at the American College of Sports Medicine supports and applauds your efforts to become more fit and healthy! We believe the 2019 Fitness Index rankings can help inform decisions that will make your city and its residents healthier.
The 2019 American Fitness Index rankings will be released on May 14, 2019.
Sign up to get exclusive insights into the report on the day of the release.


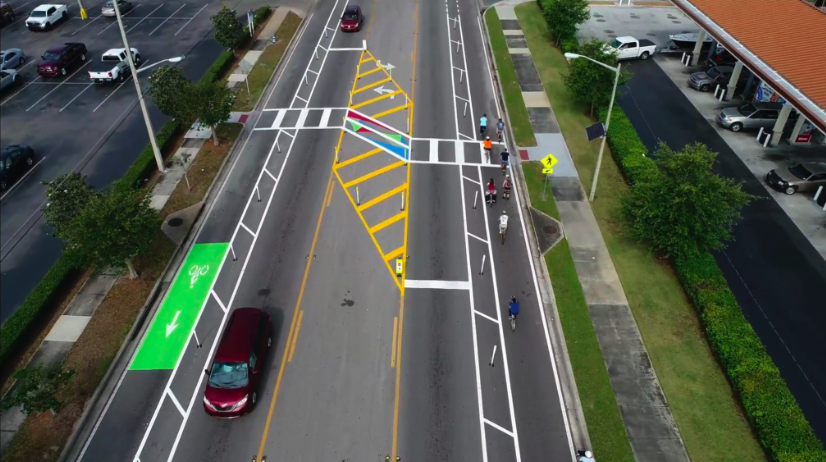
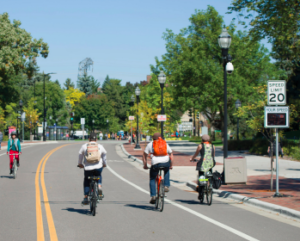 #5 What do Complete Streets look like?