Category: In the News

physical activity american fitness index rankings blog

Physical Activity | Benefits Year-Round

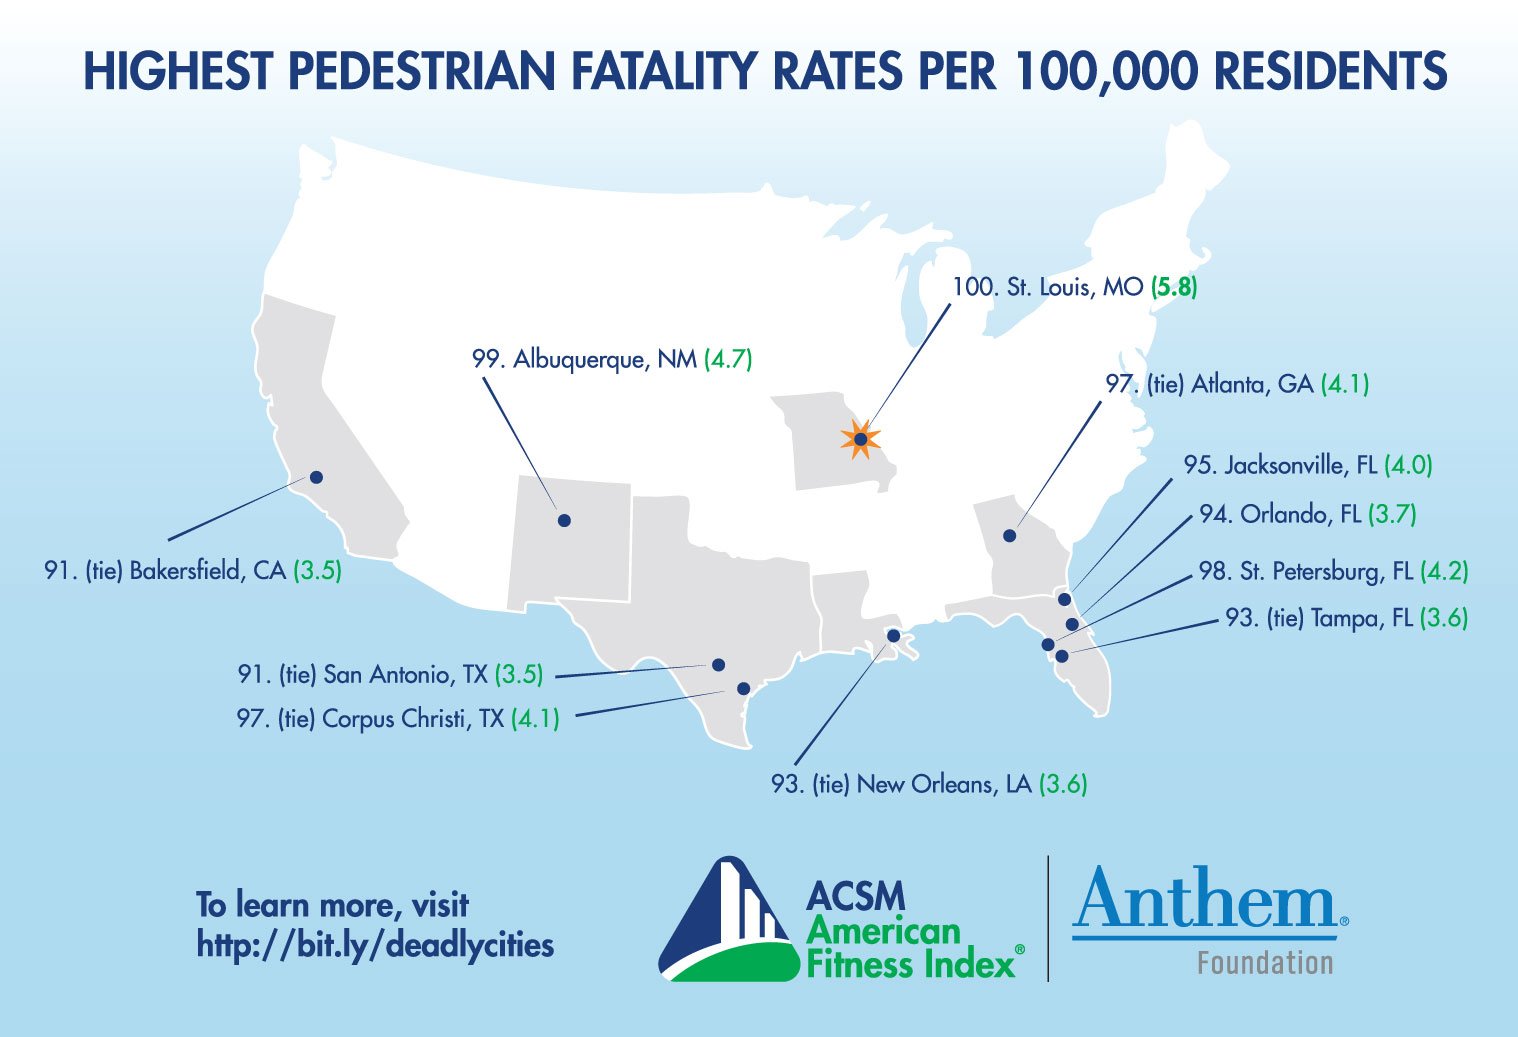
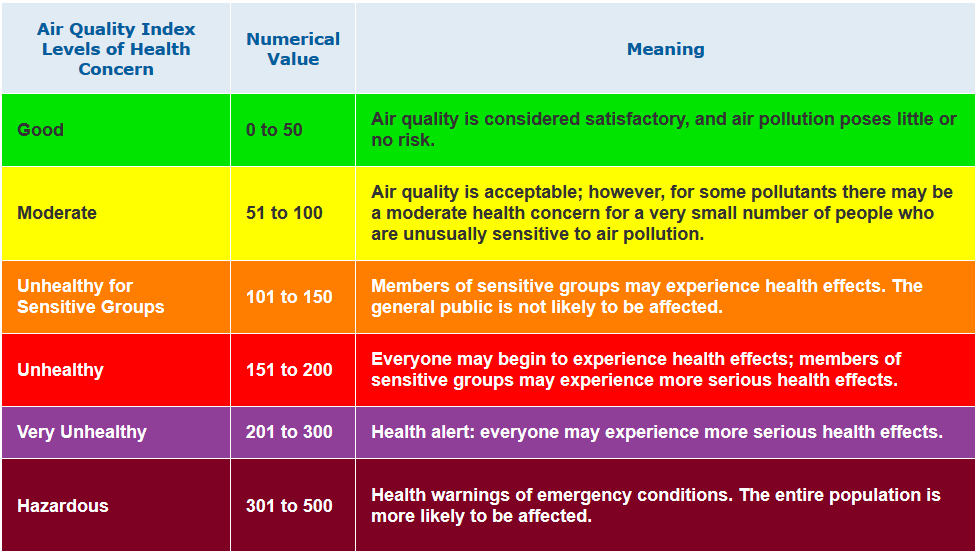
The American College of Sports Medicine (ACSM) American Fitness Index is one of the most credible and reliable assessments of individual and community fitness across the United States. The indicators included in the report are timely, relevant, and valuable to address both unique and common factors between cities. In 2019, The Fitness Index added four new indicators: pedestrian fatalities, air quality, Bike Score, and Complete Street policies.

The advisory board added the indicators mentioned above to place more emphasis on the built environment and the role it plays on health for the population. It is doubtful that not being able to enjoy the outdoor facilities in your neighborhood would create an often-insurmountable barrier for additional physical activity.

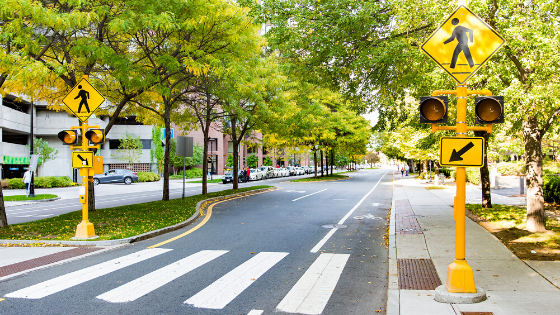
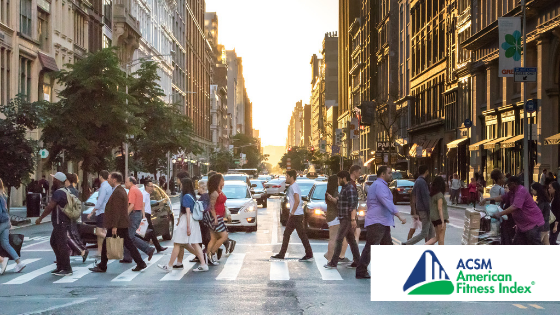
With the new year in full swing, many have made a resolution to be more active and take better care of their health. Still, more than half of the country is in the middle of a cold winter, which can mean slippery roads and less daylight in the afternoon. The environment many Americans call home may not encourage a healthy behavior change. And sure, they may decide that they will brave the cold to take a walk. Still, as soon as they step outside on to the public sidewalk, they lose their footing because the city has not done such a great job of clearing the snow and ice from the last winter storm. Or stories of people falling victim to car accidents while walking may be discouraging. These factors are within the control of the local governments, and these indicators will allow them to have the information to create a space for a positive change. Being able to walk safely because the sidewalk is not slippery or more streetlights for better visibility may encourage more sustainable behavior.

Living a more active lifestyle has numerous benefits for people of all ages. The current recommendations for physical activity include 150 min/week of moderate-intensity aerobic physical activity or 75 min/week of vigorous aerobic physical activity, and at least two days of strength training that involves all major muscle groups. Increased physical activity has the potential of leading to long-term health benefits. There is substantial evidence of the positive effects associated with increased physical activity on physical health, mental health, and all-cause mortality. Look above and notice that exercise was never mentioned before this sentence. You can be active in any matter you choose.

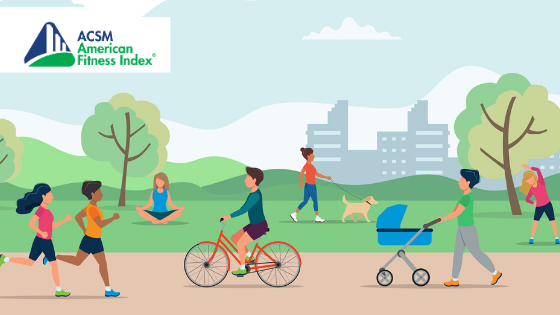
According to data from the 2019 American Fitness Index, 51.2% of residents report meeting the aerobic activity guidelines. Of those, only 22% stated they were meeting both aerobic and strength recommendations. While there are many options for indoor fitness, they can be costly and inconvenient. Communities can encourage residents to meet both aerobic and resistance training recommendations by placing outdoor adult fitness gyms in local parks. Cities falling in the top 25 of the fittest cities in the U.S. have about 35% more residents living within a 10-minute walk to a local park than other cities. This proximity to parks provides greater opportunity for residents to be more active. A higher number of outdoor adult fitness parks, especially in underserved communities, may increase the likelihood of producing positive change in overall fitness and health.

On an individual level, finding ways to increase physical activity can be done everywhere you frequent. At home, choosing to do a few jumping jacks or squats during a commercial break will improve your physical activity when done for an hour-long television show. When at work, taking at least one minute every hour to walk around the office can make a big difference in a week. In your neighborhood, getting off the bus a stop early to walk will increase your physical activity. All these small changes can yield significant benefits to your health and fitness.

Whatever you can do to increase the amount of time you are moving is going to be the best thing you can do for your health. Please beware of trying to do something that you genuinely dislike, as these are the things you will most likely not do for very long. So, go for a walk or play with your kids. Either way you should aim to have fun and have an active new year.

And just for good measure, if you haven’t already, and it’s safe to do so, how about taking a short walk? Remember, health is wealth.

Author: Alvin Morton, III, M.S., is a doctoral student at the University of Tennessee, Knoxville and a member of the American Fitness Index Advisory Board.

blog, health disparities in built environments

Disparities in the Quality of Physical Activity Environments

There are race, ethnic and socioeconomic status (SES) disparities in physical activity. The disparities differ by domain of physical activity (e.g., occupation, transportation), but there is consistent evidence that leisure time physical activity is lower among individuals with lower income and members of most race and ethnic minority groups. One possible explanation of these disparities is that communities of color and those living in lower-SES neighborhoods have lower quality physical activity environments. Environments can be designed to make it easier to be active or to create barriers to physical activity. There are national health objectives and public health imperatives to reduce physical activity disparities and improving environments in disadvantaged neighborhoods could be a strategy for long-term benefits for entire communities.

Our research group has studied disparities in two general types of physical activity environments, or places where people are often active. One is the park environment, the other is the streetscape environment, and both are relevant to leisure time physical activity. Parks are obvious places for recreational activity, but walking is the most common type of activity at virtually all ages, and the most common place to walk is on sidewalks and streets in the neighborhood.


Access to parks and park quality

Past studies of access to parks have produced mixed results about whether there are fewer parks in low-income communities of color. Our research group was particularly interested in whether there were disparities in the quality of parks. We defined quality as the number of different types of sports and physical activity facilities, such as ball fields, trails, basketball courts and playgrounds, as well as number of amenities such as restrooms and water fountains.

We observed 543 parks in and around Baltimore, MD and Seattle, WA neighborhoods selected to vary widely on SES. The results were very different across regions. In the Baltimore region we found the expected lower quality of physical activity facilities and amenities in mostly-minority neighborhoods. In the Seattle region, the surprising result was that lower-income areas had parks with more sports and physical activity facilities and more amenities. We referred to the Seattle pattern as “equitable differences,” meaning these economically deprived neighborhoods needed higher quality parks because they did not have access to fitness centers and exercise programs that required fees and transportation.


Streetscape quality

Studies of overall community design, such as having shops and schools within walking distance, often do not find disparities across race, ethnic and SES groups. However, our interest was in the quality of streetscapes, or the extent to which streets and sidewalks are designed to be comfortable, attractive and safe for pedestrians. We conducted observations in over 2200 locations in Baltimore, MD, Seattle, WA and San Diego County, CA regions. We coded presence and quality of sidewalks, quality and safety of street crossings, aesthetic features like landscaping and indicators of social disorder such as graffiti.

Again, the results were complex. Though there were some differences across regions, there were many more common findings. We found disparities, such that low-income and mostly-minority neighborhoods had worse aesthetic and social-disorder features, such as graffiti, litter, broken windows and fewer trees. But we also saw evidence of “equitable differences,” with high-income and mostly white neighborhoods generally having worse crosswalks, intersections and sidewalks.


Lessons learned: Patterns of environmental disparities are local

Our studies found some evidence of environmental “disparities:” park quality and pedestrian features that were worse in low-income and/or mostly-minority neighborhoods. We also found “equitable differences:” park quality and pedestrian features that were worse in high-income and/or mostly white neighborhoods. These patterns had not been reported before. The park and streetscape features that exhibited disparities varied between cities, but we discovered a clue that helps explain some of the differences by region. In the Seattle region, a King County ordinance guaranteed equal facilities and services across neighborhoods that could explain the high-quality parks in low-income neighborhoods. This is evidence that local policies determine whether there are disparities in physical activity environments.

It should not be assumed that parks and pedestrian streetscapes are lower quality in low-income areas and communities of color. It should also not be assumed all neighborhoods have equal quality physical activity environments. The only way to determine local patterns of environmental disparities is to collect local data, but such data are rarely collected.

Park and streetscape features are modifiable and offer a feasible and affordable approach to creating activity-friendly environments in all neighborhoods.  Conducting observations in numerous neighborhoods can help local policy makers, planners and community groups identify disparities, recommend targeted changes and increase physical activity opportunities for all residents, regardless of race, ethnicity or income. Simple observational measures are available that can be used by community residents to assess their neighborhood environments. Community groups are encouraged to work with government agencies to document the quality of physical activity environments in their neighborhoods and use local data to develop plans for improvement.


References

Thornton, C.M., Conway, T.L., Cain, K.L., Gavand, K.A., Saelens, B.E., Frank, L.D., Geremia, C.M., Glanz, K., King, A.C., and Sallis, J.F. (2016). Disparities in pedestrian streetscape environments by income and race/ethnicity. SSM-Population Health, 2, 206-216.

Engelberg, J.K., Conway, T.L., Geremia, C., Cain, K.L., Saelens, B.E., Glanz, K., Frank, L.D., and Sallis, J.F. (2016). Socioeconomic and race/ethnic disparities in observed park quality. BMC Public Health, 16:395.

Research brief


James Sallis, PhD, FACSMJames F. Sallis, Ph.D, FACSM is former Vice President of ACSM and is a member of the ACSM Strategic Health Initiative on Health Equity. He has been studying physical activity about 40 years, and his research interests are promoting physical activity and understanding policy and environmental influences on physical activity, nutrition, and obesity.  He has authored over 700 scientific publications, is one of the world’s most cited authors, and is a member of the National Academy of Medicine.

male pedestrain about to cross a busy intersection

America’s Most Dangerous Cities for Pedestrians

Across America’s 100 largest cities an average of  2.2 pedestrians were killed per 100,000 residents in the last year.   With a total population of 64,504,498  in those cities,  that means approximately 1,419 lives were lost.

A variety of factors may contribute to pedestrian fatalities, including distracted driving, a lack of proper lighting, inadequate sidewalks and unsafe crossing and intersections.

America's Most Dangerous Cities for Pedestrians
America’s Most Dangerous Cities for Pedestrians

The most dangerous cities for pedestrians are (average deaths per 100,000 residents):

100. St. Louis, MO (5.8)

99. Albuquerque, NM (4.7)

98. St. Petersburg, FL (4.2)

97. (tie) Corpus Christi, TX (4.1)

97. (tie) Atlanta, GA (4.1)

95. Jacksonville, FL (4.0)

94. Orlando, FL (3.7)

93. (tie) Tampa, FL (3.6)

93. (tie) New Orleans, LA (3.6)

91. (tie) Bakersfield, CA (3.5)

91. (tie) San Antonio, TX (3.5)

How does your city rank? 

active transportation op-ed template blog

Advocate for Active Transportation in Your Community | Op-ed Template

A key step in increasing active transportation habits and avenues  in your community is working to increase awareness of the economical, personal health and environmental benefits of walking and biking. Submitting an op-ed to your local newspaper, magazine or television station can be a productive way to spread the word about these benefits.

The American Fitness Index and ACSM’s ActivEarth Task Force have partnered to supply an op-ed template that you can use to generate or renew interest in active transportation methods in your community. The template can be easily customized for your local community.  Click here to download the template!  

Include stats from the Fitness Index Rankings report  in your op-ed.

Want to learn more about supporting active transportation? Check out more ActivEarth resources here.

blog_afi_pedestrian safety

Pedestrian Safety Concerns Hinder Active Transportation

In 2018, 6,227 pedestrian fatalities occurred in the United States, the highest number in nearly three decades and a four percent increase from 2017 according to a report earlier this year from the Governors Highway Safety Association (GHSA). “While we have made progress reducing fatalities among many other road users in the past decade, pedestrian deaths have risen 35 percent,” noted GHSA Executive Director Jonathan Adkins. Pedestrians were projected to account for 16 percent of all traffic deaths in 2018, compared to 12 percent in 2008. The high rate of pedestrian fatalities is a growing public health issue that often gets little notice, but should, particularly now that more individuals are walking, running or biking for exercise and commuting.

Following advice from experts, such as those from the American College of Sports Medicine and perhaps their own physicians, many Americans are becoming more physically active to improve their health, reduce their risk for many diseases and increase their quality of life. As a result, individuals have taken to the streets to walk, jog, run and bike. The American Fitness Index incorporates several related measures, including the percent of residents bicycling or walking to work, the Walk Score and Bike Score for cities and the percent of residents using public transportation, as it calculates city fitness scores and rankings.

Despite knowing the health benefits, safety concerns can be a major barrier to physical activity for individuals who are uncomfortable exercising on or near city streets, since sharing the streets with motor vehicles poses a risk of injury or even death for pedestrians. For this reason, the Advisory Board of the Fitness Index added pedestrian fatality rates as a health outcome indicator in 2019. The Advisory Board believes the higher the pedestrian fatality rate, the more likely it will be a barrier for residents’ physical activity, leading to a less fit city.

In the 2019 Fitness Index rankings, four of the 10 cities with the highest pedestrian fatality rates were located in Florida (St. Petersburg, Jacksonville, Orlando and Tampa) and two more were also in the southeast region (Atlanta and New Orleans). On the other end of the spectrum, of the cities with the lowest rates, two were in Virginia (Arlington and Virginia Beach) and two others were in Nebraska (Lincoln and Omaha).

As you have been driving, perhaps you have worried about how to safely pass a walker, runner or cyclist on the street? This knowledge gap is a major problem for drivers when people are exercising or commuting on foot particularly in early morning, at dusk and especially at night when visibility is poor. Over the past 10 years, nighttime crashes accounted for more than 90 percent of the total increase in pedestrian deaths.

Next Steps

To reduce this trend, (which has been accomplished in some cities!) additional efforts need to focus on what the city, drivers and pedestrians can do to increase safety. For example, cities can adopt Complete Streets policies, one of the Fitness Index indicators, which focus on designing, constructing and maintaining streets to be safe for all users. These designs can help slow drivers and encourages them to be more cautious around pedestrians. Communities can also help reduce pedestrian fatalities by educating both drivers and pedestrians on following traffic rules and speed limits and safety measures when exercising or commuting on streets. For additional resources to improve pedestrian safety, visit the National Highway Traffic Safety Administration.

The bottom line is that attention to pedestrian safety by city leaders, drivers and pedestrians themselves are all needed to reduce pedestrian fatalities.


Author: Terrell W. Zollinger, Dr.P.H, MSPH

halloween safety tips

Halloween Safety Tips

Halloween can be a fun holiday for families if you follow these safety tips to keep trick-or-treaters and party goers safe at night!

Be Safe

• There is safety in numbers. Travel in pairs or groups.
• Use crosswalks and be predictable. Walk on the left side (against traffic) and bike on the right side of the road (with traffic).
• Avoid costumes with dragging or dangling materials and vision restricting masks.
• Wear comfortable shoes, layer clothing as needed, and carry water to stay hydrated.

Be Seen

• Wear blinking lights, glowsticks, and bright or reflective clothing.
• Carry flashlights or headlamps.
• Drivers may have poor visibility at night and during sunset. Use caution during these times.

Be Social

• Host events such as Trunk-or-Treat at schools or parks to incorporate games and physical activity.
• Invite friends and family to trick-or-treat in more walkable communities with sidewalks and streetlights (those with higher Walk Scores).
• Participating in neighborhood activities builds social capital which contributes to a safer community.

halloween safety tips


Have fun and enjoy a safe holiday!

Download the Infographic 

Author: Melissa Wehnert Roti, Ph.D., FACSM, ACSM-EP, GEI

American Fitness Index Anthem Foundation fresh food availability

Supporting Local Communities in the Fight Against Food Insecurity

The American Fitness Index serves as a tool and resource for community stakeholders to address conditions in the environments that negatively affect a person’s overall health and identifies target areas to create healthier, more active communities.

Eliminating food insecurity is a critical factor in improving the overall health and well-being of individuals in the communities we serve, which is why the Anthem Foundation recently partnered with The Food Trust. Our collaboration will expand The Food Trust’s community-based program, the Healthy Food Retail Initiative, aimed at increasing access to healthy food and promoting health equity in cites in Indiana, Ohio and California.

Through our work with ACSM and programs like the Indianapolis Healthy Food Retail Initiative with The Food Trust, the Anthem Foundation is committed to creating meaningful partnerships with organizations, targeting specific, preventable health concerns and addressing the conditions in our environments which negatively impact individuals within communities.

For example, the 2019 Fitness Index found that only 33.9 percent of Indianapolis residents are eating two or more fruits a day and just 15.1 percent of residents are eating three or more vegetables each day. Data also showed more than one in three Indianapolis residents live in low food access areas where fresh food is difficult to find. Through these findings, it was clear that far too many Hoosiers are living without reliable access to a sufficient supply of affordable, nutritious food.

Fortunately, our partnership with The Food Trust recently expanded the Healthy Food Retail Initiative into five additional communities on the Eastside of Indianapolis, with markets and convenience stores increasing inventory and promotion of fresh produce and other heart-healthy foods. These locations also serve as “community health hubs” by providing health screenings, nutrition education and cooking lessons.

We believe giving back is not only a privilege, but a responsibility that we all share. Since the Foundation’s inception, we have remained committed to improving health and strengthening local communities through contributions to organizations committed to empowering communities to create healthier generations.


Author: Stephen Friedhoff, MD, Chief Clinical Officer, Anthem, Inc.

Since 2006, the Anthem Foundation has awarded the American College of Sports Medicine (ACSM) over $1.2M as a founding partner to establish the American Fitness Index.

Seasonal shopping at your local farmers market

Eating a wide variety of colorful fruits and vegetables is the ideal way to get the necessary vitamins and minerals that your body needs. Planning meals around food that is in-season is a great way to stay healthy and keep variety in your diet!

Now that you know eating seasonally has great health benefits, how do you start planning your fresh meals? The first step is knowing where to buy ingredients. Your local farmers market is the perfect place to get seasonal produce because the sellers have likely traveled less than 50 miles from where they grow to get to the market. You can’t get fresher than that! An added bonus to shopping at your local farmers market is that you are supporting growers in your own community. This helps to build and maintain your local economy, as well as strengthen the ties of your neighborhood. Finally, many farmers markets also accept Supplemental Nutrition Assistant Program (SNAP) and Women, Infants, and Children (WIC) vouchers to make sure that fresh food is accessible to all. Not sure where the closest farmers market is located? The US Department of Agriculture (USDA) has a search tool!

The next step in planning fresh meals is knowing which produce is currently in-season in your area. This can vary depending on the climate in your hometown, but the below chart can be used as a basic reference.

seasonal produce chart

To find seasonal food in your area, use the Seasonal Food Guide.

Now it’s time to have fun and decide which foods you will eat! Try mixing in your favorites, as well as some new options to keep meals exciting and maximize your nutrient intake. Want to try a new food, but not sure the best way to prepare it? Ask the seller! As the one who has grown the food, they will be very familiar with its flavor and will be able to recommend what other foods pair well. Enjoy!

Download the above chart as a PDF. 

air quality and outdoor exercise blog post

Air Quality and Outdoor Exercise

There is incontrovertible evidence linking poor air quality to adverse health outcomes. This is especially true for people with pre-existing conditions such as heart disease, stroke, asthma and chronic obstructive pulmonary disease. However, healthy people are at risk too. Exposure to air pollution has been linked to a higher risk of developing asthma, and recent studies have identified links between air pollution and adverse pregnancy outcomes.

The American Fitness Index added air quality as an indicator of a healthy and fit city for the first time with the 2019 rankings release. The Fitness Index used the Air Quality Index (AQI) from the Environmental Protection Agency which measures major air pollutants, including particle pollution, ground level ozone, sulfur dioxide and nitrogen dioxide, and carbon monoxide. The Fitness Index’s 2019 Summary Report notes that the 100 largest cities in the U.S. average only 62 percent of the year with good air quality. That means for over a third of the year residents in these cities are breathing polluted air that is harmful to their health.

The AQI provides guidance as to the safety of the air quality. You can download the airnow.gov app for your smart phone or visit www.airnow.gov, and review the AQI for an entered zip code.

Air Quality Index Graphic
Source: Environmental Protection Agency’s Air Quality Index www.airnow.gov

Of course, we want people to be physically active, and better yet, to be active outdoors. While air pollution can affect your health, the health benefits of being physically active outweigh the risks of air pollution for most healthy individuals. However, it is important to keep in mind that an adult exercising at a moderate level of exertion exchanges about six liters of air per minute! An athlete running at 70 percent of their maximal oxygen uptake for the length of a marathon inhales the same volume of air as a sedentary person does in two days!

Tips to maintain an active lifestyle when air quality is poor:

  • Exercise earlier in the day. Both particulate pollution and ground level ozone tend to accumulate throughout the day.
  • The vast majority of air pollution comes from tailpipes – cars and trucks on the road – so avoid outdoor activity during commuting time (7:30 a.m. – 9:00 a.m., and 4:00 p.m. – 7:00 p.m.), and when possible avoid exercise next to heavily trafficked roadways.
  • Consider indoor activity opportunities like going to the gym, walking laps at the mall or working out along with an exercise video (local libraries often lend these for free).
  • It is important to note that a scarf or paper mask does not protect you from the poor air quality.

Finally, think about what you can do as an individual to reduce your contribution to poor air quality by using public transportation when possible, walking or biking to work or school, combining driving trips, eliminate idling, avoiding wood-burning and replacing or installing ultra-low nitrogen oxide water heaters. If we all do our part to clean the air, it will make the environment safer for the outdoor activities we love.

Author: Liz Joy, MD, MPH, FACSM, Intermountain Healthcare

ACSM American Fitness Index and Anthem Foundation

Partnership Between American Fitness Index and Anthem Foundation is Twelve Years Strong

The Anthem Foundation is embedded in communities across the country where it supports programs that build awareness about the importance of active lifestyles and healthy behaviors. One of the many ways we are helping to increase awareness and improve overall health is through our partnership with the American College of Sports Medicine (ACSM). Since 2006, Anthem Foundation has granted over $1.2M to ACSM as a founding partner in an effort to establish the American Fitness Index, a tool and resource for community stakeholders to address conditions in the environments that negatively affect a person’s overall health and identifies to create healthier, more active communities.

For the second year in a row, Arlington, VA received the title of ‘Fittest City’ in America in the 2019 American Fitness Index rankings. The findings of the 2019 Fitness Index are not only a great indicator of how well communities are encouraging fitness among their residents, but also reveal how social, economic and physical conditions of health within communities directly impact the health and fitness levels of America’s largest cities.

According to Healthy People 2020, a science-based initiative launched by the U.S. Department of Health and Human Services, nearly everyone is impacted by conditions in the environment that negatively affect a wide range of health, functioning, quality of life outcomes and risks in one way or another. A way to look at the health of individuals and our communities starts in our homes, schools, workplaces, neighborhoods and communities. By taking a deeper look into these areas, we can understand why some Americans are healthier than others, and focus on interactions and relations to address why other Americans are not as healthy, and come up with opportunities and solutions on how to improve the problematic areas.

Part of our ongoing strategy at the Anthem Foundation is to create meaningful partnerships with organizations, targeting specific, preventable health concerns and addressing the conditions in our environments’ social determinants that can negatively impact them. Together with the ASCM and the Fitness Index, we can continue to look toward a brighter future by providing the necessary tools and resources to benefit people of all ages and backgrounds within our communities.


Author: Stephen Friedhoff, MD, Chief Clinical Officer, Anthem, Inc.